155.3
P&C Severity CPI
+3.1%
YoY Change
149.5
CPI-U Index
+5.7
Gap vs CPI-U
Data as of December 2025 | Base: January 2010 = 100
The standard Consumer Price Index (CPI-U) is designed to measure inflation for typical household consumption. But for Property & Casualty insurance actuaries, it significantly underweights the cost components that actually drive claims severity:
This creates a systematic gap when using CPI-U for loss trending and rate adequacy analysis.
I built a P&C Severity CPI that reweights Bureau of Labor Statistics CPI components to better approximate the inflation experienced in insurance claims payments.
| Category | Weight | P&C Rationale |
|---|---|---|
| Auto Repair | 20% | Parts, labor, glass, paint for auto PD and collision |
| Physicians | 15% | Medical evaluations, IMEs, treatment costs in BI claims |
| Hospital | 15% | Inpatient costs for severe bodily injury claims |
| Shelter | 20% | Proxy for construction/rebuild costs (lumber, labor) |
| Core CPI (Wages) | 15% | Legal fees, adjusters, administrative costs |
| Core CPI (General) | 15% | Residual services, general inflation exposure |
The index is calculated as:
\text{P\&C\_CPI}(t) = \sum_i w_i \times \frac{\text{CPI}_i(t)}{\text{CPI}_i(2010)} \times 100
Where:
Data as of December 2025 | Base: January 2010 = 100
import pandas as pd
import matplotlib.pyplot as plt
import matplotlib.dates as mdates

# Load both datasets
df_severity = pd.read_csv('data/severity_cpi.csv', parse_dates=['date'])
df_cpi = pd.read_csv('data/All_Items.csv', parse_dates=['date'])

# Rebase CPI-U to Jan 2010 = 100
base_value = df_cpi[df_cpi['date'] == '2010-01-01']['value'].values[0]
df_cpi['CPI_U_rebased'] = (df_cpi['value'] / base_value) * 100

# Merge datasets
df = df_severity.merge(df_cpi[['date', 'CPI_U_rebased']], on='date', how='inner')

fig, ax = plt.subplots(figsize=(8, 4.5))

# Plot CPI-U (solid blue line)
ax.plot(df['date'], df['CPI_U_rebased'],
        color='#1e3a8a', linewidth=2.5, linestyle='-', label='CPI-U (All Items)')

# Plot P&C Severity CPI (dotted red line)
ax.plot(df['date'], df['P&C_Severity_CPI'],
        color='#dc2626', linewidth=2.5, linestyle=':', label='P&C Severity CPI')

# Formatting
ax.set_xlabel('Date', fontsize=12)
ax.set_ylabel('Index (Jan 2010 = 100)', fontsize=12)
ax.set_title('P&C Severity CPI vs CPI-U (2010 = 100)', fontsize=14, fontweight='bold')
ax.legend(loc='upper left')
ax.grid(True, alpha=0.3)

# Format x-axis
ax.xaxis.set_major_locator(mdates.YearLocator(2))
ax.xaxis.set_major_formatter(mdates.DateFormatter('%Y'))

plt.tight_layout()
plt.show()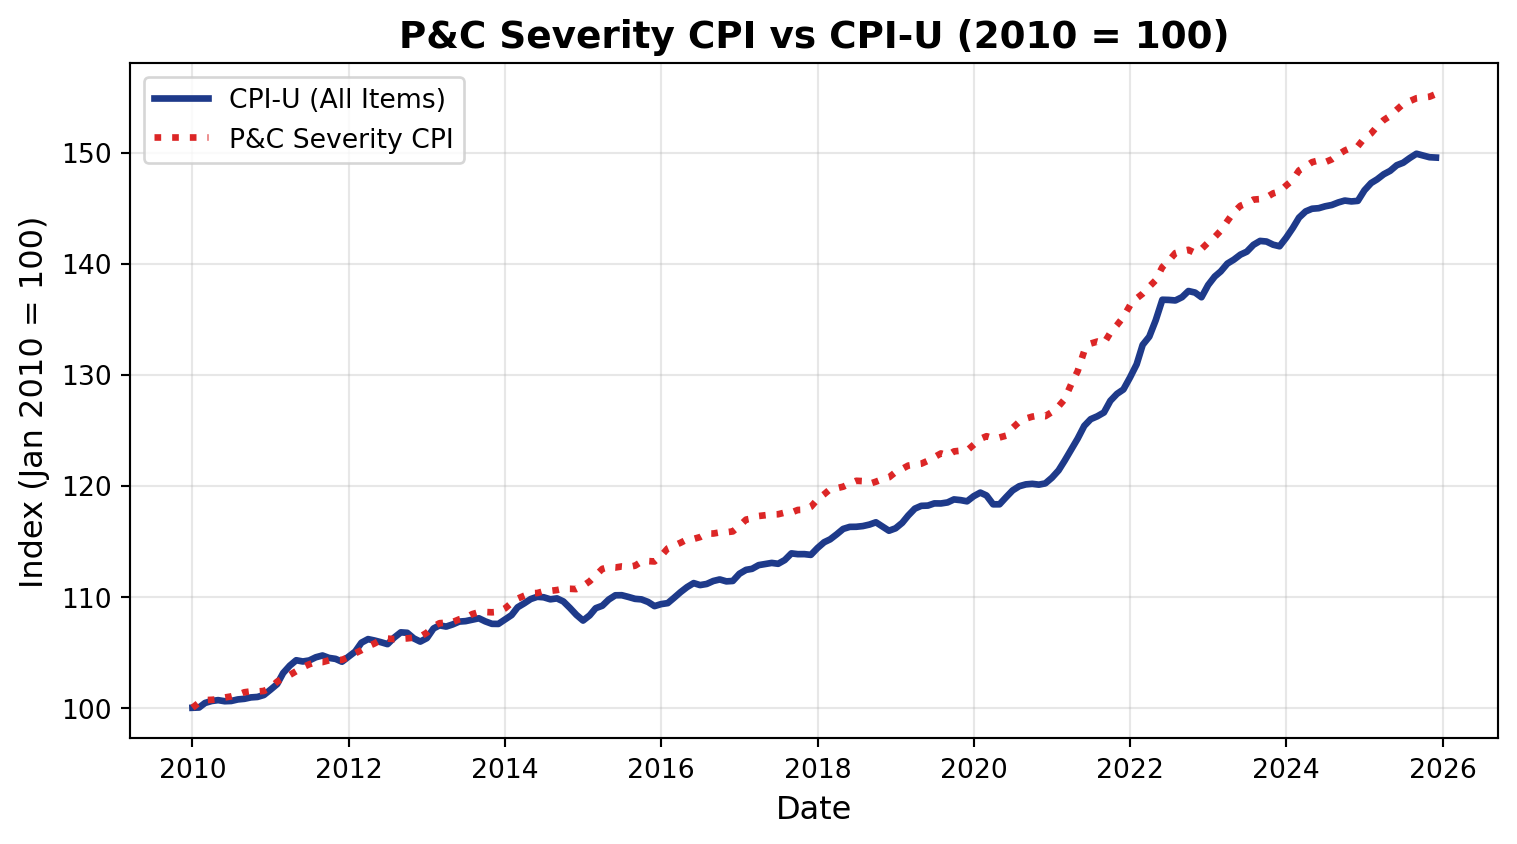
import pandas as pd
import matplotlib.pyplot as plt

df = pd.read_csv('data/severity_cpi.csv', parse_dates=['date'])

# Calculate YoY change
df['YoY_Change'] = df['P&C_Severity_CPI'].pct_change(periods=12) * 100
df_yoy = df.dropna(subset=['YoY_Change'])

fig, ax = plt.subplots(figsize=(8, 4.5))

colors = ['#22c55e' if x < 3 else '#eab308' if x < 5 else '#dc2626' for x in df_yoy['YoY_Change']]
ax.bar(df_yoy['date'], df_yoy['YoY_Change'], color=colors, width=25, alpha=0.8)

ax.axhline(y=0, color='black', linewidth=0.5)
ax.axhline(y=3, color='gray', linestyle='--', alpha=0.5, label='3% threshold')

ax.set_xlabel('Date', fontsize=12)
ax.set_ylabel('YoY Change (%)', fontsize=12)
ax.set_title('Annual Inflation Rate: P&C Severity CPI', fontsize=14, fontweight='bold')
ax.grid(True, alpha=0.3, axis='y')

plt.tight_layout()
plt.show()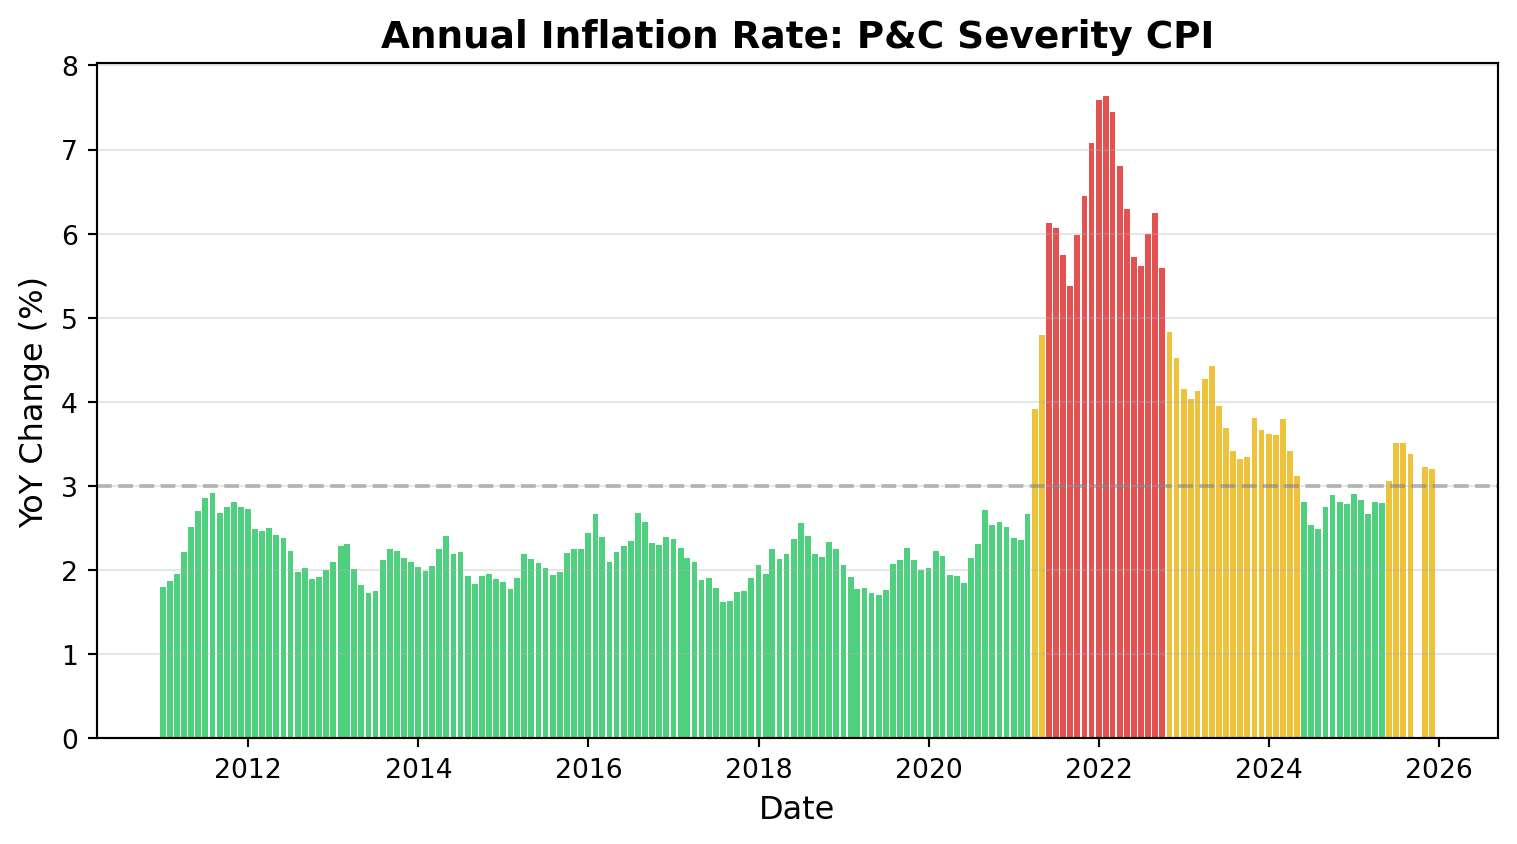
The P&C Severity CPI has consistently outpaced general CPI-U inflation since 2010, with notable acceleration during:
Important caveats:
Always supplement with loss development analysis and market-specific data.
The full methodology, data pipeline, and source code are available on GitHub: P&C Severity CPI Repository
The index updates monthly via GitHub Actions, pulling fresh data from the Bureau of Labor Statistics API.